WM & HS Radar (Block-Free)The W/M + H&S Radar automatically scans for double-top/double-bottom (M and W) and head-and-shoulders style reversal structures across any timeframe.
How it works:
Detects repeating pivot formations that resemble W (double bottom) or M (double top) structures.
Draws neckline levels for each pattern and highlights potential breakout points.
Confirms breakout validity when price closes beyond the neckline (optionally requiring a 1.2× volume surge).
Generates alerts when a valid W Long or M Short trigger occurs.
Best used on: 15m, 1h, or 4h charts to identify medium-term reversal entries.
Recommended companion: Orion Daily HL + Volume indicator for higher-timeframe context.
Alert Options:
“W Long Trigger” → Bullish reversal breakout.
“M Short Trigger” → Bearish reversal breakout.
Usage Tip:
Combine with your support/resistance zones and ATR-based stop sizing from your Money Momentum Tracker to validate A-setups only.
ابحث في النصوص البرمجية عن "volume indicator"

Nifty 50 Weighted Volume IndicatorThis takes the volume of the cash market as per the composite weighted average of the Nifty 50 Components.
You can use this at your discretion to take calls on Index trades.

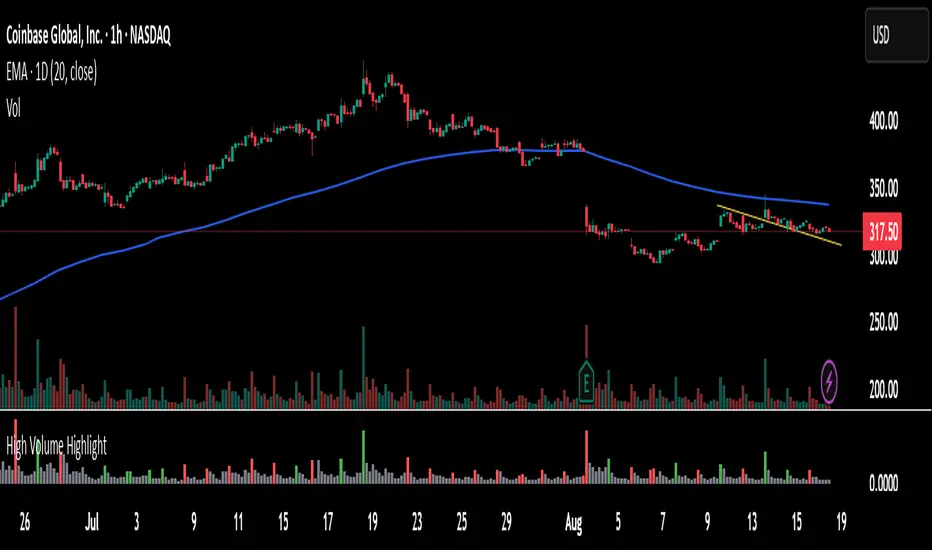
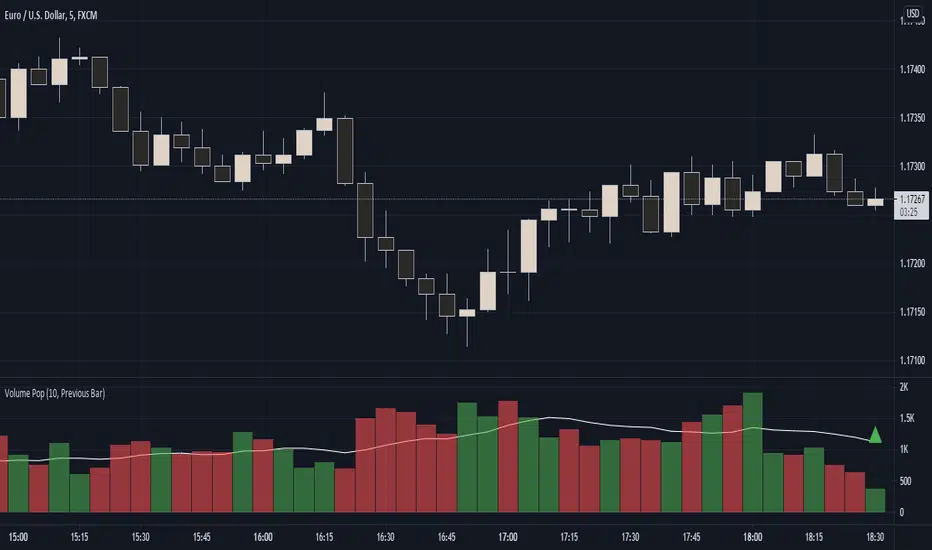
High Volume Highlight - Pto compare volume indicator from prev bars. How to use it, short it when the red bar shows and long it when the green bar shows
VIDYA (Chande)This script brings you VIDYA – the Variable Index Dynamic Average, developed by Tushar Chande. It’s not your typical moving average. Unlike the standard SMA or EMA, VIDYA adapts its speed and smoothness based on real-time market momentum using the Chande Momentum Oscillator (CMO).
Think of it like a moving average that gets faster during strong trends and slows down during sideways or choppy markets — just like how a smart trader would!
🧠 What Makes VIDYA Different?
Traditional moving averages use fixed smoothing, so they lag more during big moves or chop during weak trends.
VIDYA fixes that by adapting its behavior dynamically:
When momentum is strong → VIDYA reacts faster 🚀
When momentum is weak → VIDYA smooths out the noise 🧘
⚙️ How It Works (Explained Simply):
1️⃣ CMO Calculation (Chande Momentum Oscillator):
We look at the past cmoLength candles (default 9) and:
i) Add up all the positive price changes (gains)
ii) Add up all the negative price changes (losses)
iii) Use those to compute a normalized momentum score between -100 and +100
📌 CMO = (Gains - Losses) / (Gains + Losses)
• This gives us a momentum reading that powers the next step.
2️⃣ Dynamic Alpha Smoothing:
• We convert the absolute value of the CMO into an alpha — this is the "speed" of the VIDYA.
📌 Higher momentum = higher alpha → faster response
📌 Lower momentum = lower alpha → smoother behavior
3️⃣ VIDYA Formula:
• Finally, we apply the smoothing:
📌 VIDYA = α × Price + (1 - α) × Previous VIDYA
• This equation continuously adapts to market behavior — trending or ranging.
📊 What’s Plotted?
🟠 The VIDYA Line:
A smooth, responsive line plotted on your price chart that adjusts in real-time with price momentum.
🔎 How to Use It:
✅ Use it like a moving average, but smarter:
• Price > VIDYA and rising → Trend is likely up
• Price < VIDYA and falling → Trend is likely down
• Flat VIDYA = Possible consolidation or sideways market
✅ Combine with:
• Breakout strategies (VIDYA confirms momentum)
• Reversal entries (look for price crossing VIDYA)
• Volatility filters (ignore signals when VIDYA flattens)
🧪 Bonus Tip:
Pair this with a volume indicator (like my Volume Confirmation Bars or Volume Strength Highlight) to confirm whether momentum is backed by real participation or just a fakeout.
📩 Want alerts, dual-timeframe overlays, or VIDYA with other base inputs (like typical price or HLC3)? Let me know — happy to expand this for your setup!
Stay adaptive, not reactive — trade smarter with VIDYA! 🧠📉📈

Layered Volume Delta (LVD) BarsThis volume indicator shows buying and selling delta pressure in each bar.

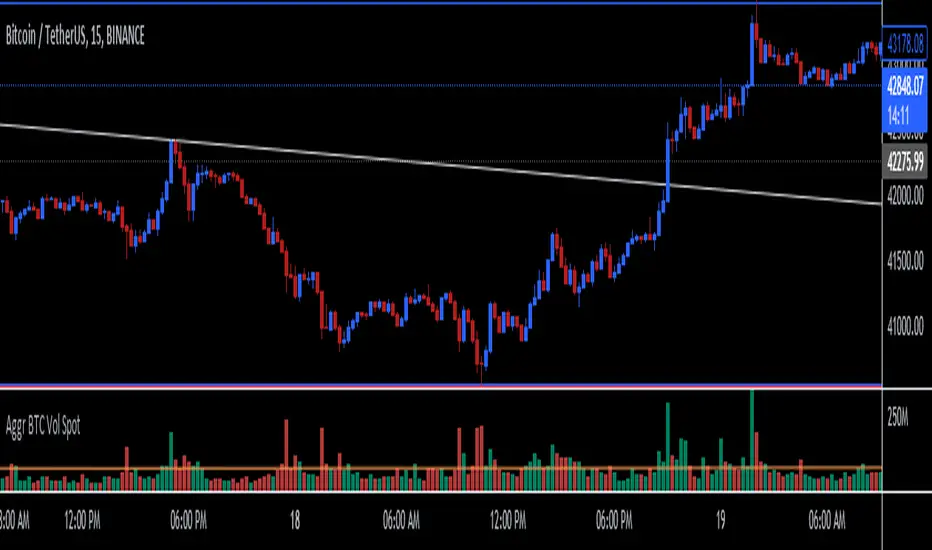
Aggregate BTC Volume Spot - Ma78erAggregate BTC Volume indicator show aggregates trading volumes of Bitcoin from multiple trading platforms.
Exchange Include:
1: Binance - BTC(USDT, USDC, FDUSD, TUSD)
2: Coinbase - BTC(USD, EUR, USDT, GBP)
3: OKX - BTC(USDT, USDC)
4: BYBIT - BTC(USDT, USDC)
5: KUCOIN - BTC(USDT, USDC)
6: KRAKEN - BTC(USD, EUR, USDT, GBP, USDC)
7: Bitfinex - BTC(USD, EUR, GBP)
8: Bitstamp - BTC(USD, EUR, USDT, GBP, USDC)
9: GATEIO - BTC(USDT)
You can also add other exchange in script manually.
Performante's Average Bitcoin Volume IndicatorThe volume of all major exchanges, including:
Bitfinex, Coinbase, Bitstamp, Bitmex, Kraken, Binance, Bithumb, Flyer, and OkEx

B/S Volume with Timeframe InputDaytrading For Success's volume indicator with timeframe input selection added. Example shown is 1 minute time frame with 5 minute input selected.

BetterVolumeAvgPinescript 5 version of buy/sell volume indicator with average. This script is original in that there are no versions of this study written in Pinescript 5 that I know of and while I've seen other buy/sell volume scripts this one includes a moving average.

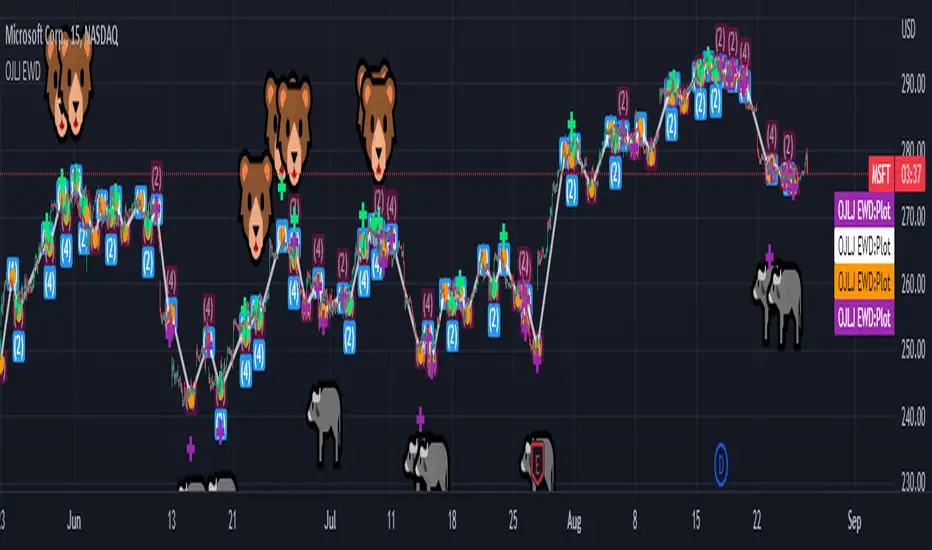
OJLJ Elliott Waves detector (Free)This script is made to identify Elliot Waves by setting a zigzag line as principal source, it identifies patterns with the most common rules, in the chart you will see a number in each wave detected, a wave could have the characteristics to be two different waves so it will be plotted the options that could be, To identify which one is most trustable I suggest to use the Fibonacci levels options as an additional note this is a free update to my existing script.
Features:
+ All waves ? (Option to show just the 5 Wave patterns recognition)
+ Draw zigzag line (Option to show the zigzag line)
+ Supports Multiple instruments, from FOREX to Stocks
+ It works on all the timeframes
+ Show Fib levels (Option to show the Fibonacci levels)
+ Fibonacci levels fit test (Green crosses mark were should a Bull wave be to fit with a Fibonacci Level While the purple crosses show were should the wave fit to be a bear trend, the more closer with the point of the wave the most trustable Example, a 5 Wave Bull could also be a 2 Bear Wave, if the green cross is closer to the orange point of the wave then is a 5 Wave Bull, if the purple cross is closer to the orange point)
+ A background color also show when a 5 pattern is identified
+ The way to plot the zigzag can be changed with 3 Input options
Characteristics to add in future updates (Please if you like it you can support me with coins):
+ Detect more than 1 cycle at the same time
+ Use a volume indicator to identify how many volume was traded in each wave
+ Implement the use of the EWO ( Elliot Wave Oscillator)
+ Improve the display
+ Identify ABC patterns
+ Add triangles and Zigzag formations
Volume price action and reaction index V1.0 (VPARI V1.0)Volume indicator adjusted according to price movement.
It is used to confirm entry into trades , Each candle represents a measure of the strength of the change in volume with the price calculated by more than one mathematical equation.
the best way to use :
Divergence, either positive or negative
It is used with Crypto currencies and stocks, not suitable for use with commodities .
The example is shown in the attached chart .
If you like it, don't forget to comment your experience using it.

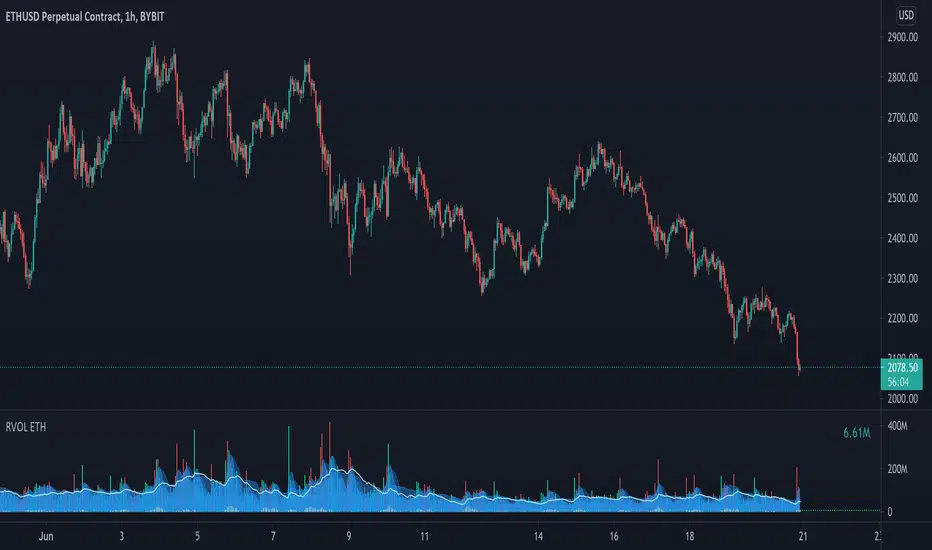
Relative Volume - ETHEREUMRelative Volume indicator that pulls data from 9 different Ethereum exchanges. Please note that this indicator only works with ETH and will not use data from your current chart.
Includes the following exchanges:
BYBIT:ETHUSD
BITFINEX:ETHUSD
BITSTAMP:ETHUSD
INDEX:ETHUSD
COINBASE:ETHUSD
FTX:ETHUSD
PHEMEX:ETHUSD
BITTREX:ETHUSD
POLONIEX:ETHUSDT
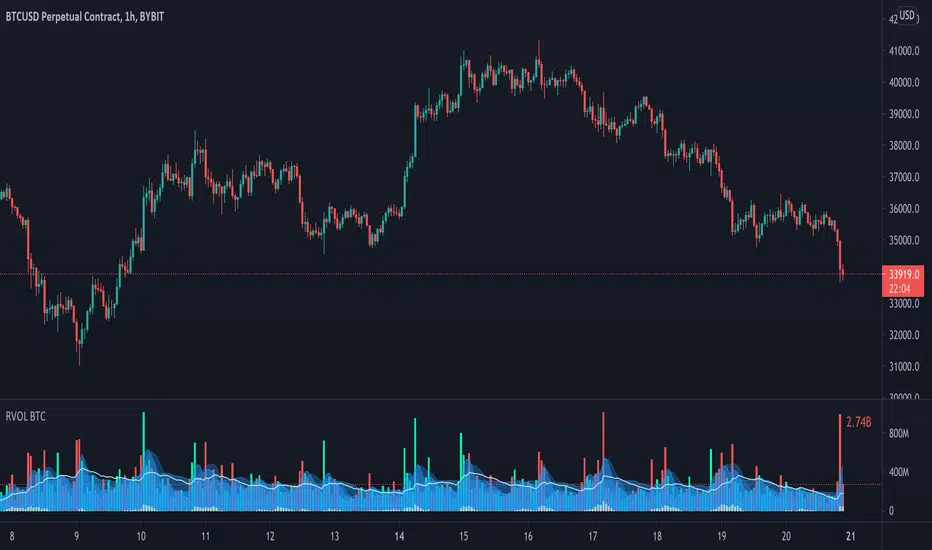
Relative Volume - BITCOINRelative Volume indicator that pulls data from 9 different Bitcoin exchanges. Please note that this indicator only works with BTC and will not use data from your current chart.
Includes the following exchanges:
BYBIT:BTCUSD
BITFINEX:BTCUSD
BITSTAMP:BTCUSD
INDEX:BTCUSD
COINBASE:BTCUSD
FTX:BTCUSD
PHEMEX:BTCUSD
BITTREX:BTCUSD
POLONIEX:BTCUSDT
Relative VolatilityRelative volatility highlights large changes in price. This was designed to be used with my relative volume indicator so that traders can see the effect of volume on price action. It is also a good tool to analyse breakout patterns to identify best entry points and waves.
Above shows relative volatility and relative volume working together.

Symbol VolumeUnlike the built-in Volume indicator and other custom scripts, this one allows to configure the volume symbol and preserves the known look and feel.

Volume %This volume indicator additionally shows in percent how much volume, e.g. in the 1-minute chart, was traded compared to the average daily volume.

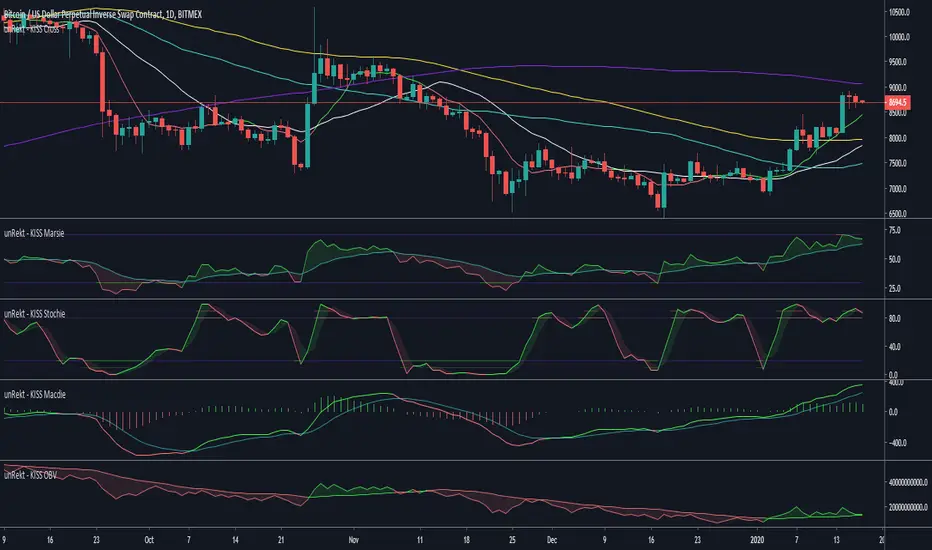
unRekt - KISS OBVOBV is the 'On Balance Volume' indicator and is part of the 'keeping it simple' series that have a similar color scheme. the OBV measures buying and selling pressure as a cumulative indicator, adding volume on up days and subtracting it on down days. The OBV can show divergences or confirm trend.
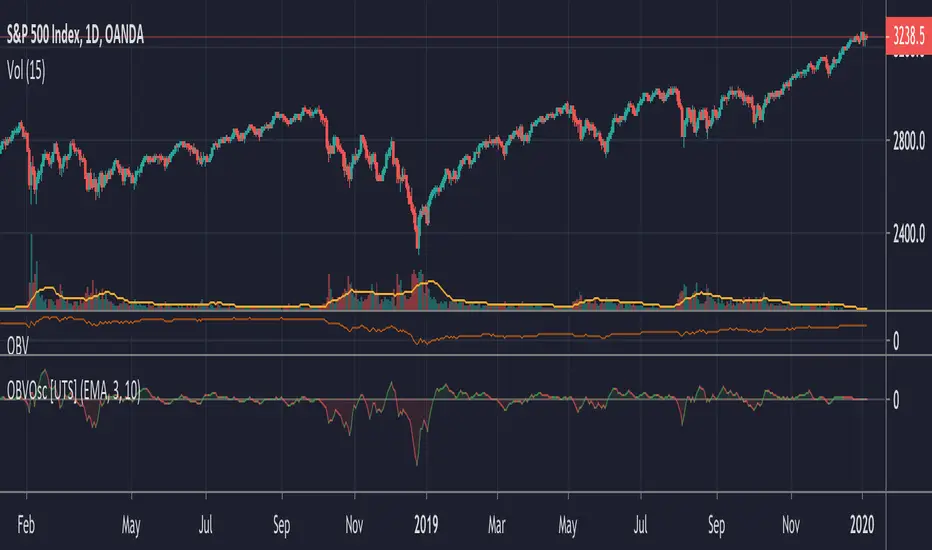
OBV Osc - On Balance Volume Oscillator [UTS]The oscillator version of the well known On Balance Volume Indicator (OBV).
General Usage
Plain old OBV can be used to confirm trends, as well as spot possible trading signals due to divergences.
A benefit of the oscillator version is that it can produce LONG or SHORT signals on zero line cross.
Moving Averages
4 different Moving Averages are available:
EMA (Exponential Moving Average)
SMA (Simple Moving Average)
VWMA (Volume Weighted Moving Average)
WMA (Weighted Moving Average)
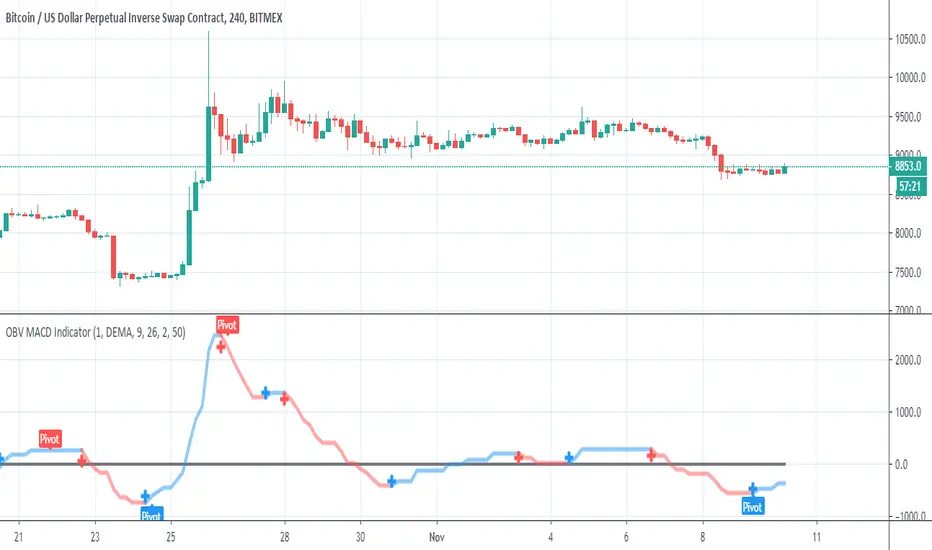
OBV MACD IndicatorSo this script is my improvement to macd that we all know . it faster and more accurate with less lag
first is based on OBV as it primary source
next we convert the OBV to MA style format , in this case we can add all form of MA in order to calculate it . as you will see in settimgs it has many type of MA as each beahave differently
I make the signal to be in linear form jst to make it more sharp/ and in the end in order to make the signal i use Alex grover method (this guy is a genius:) )
in final step we can make pivots point on our new for macd
end resolt is a faster more accurate MACD and much more options fro modification then the regular macd
this is volume indicator based so in some graph where volume does not exist this will not work
Jurik Volume Trend Strength [Jwammo12]This applies trend strength and jurik's smoothing to a volume weighted price. This converts this to a volume indicator


Weis Wave Volume (Pinescript 4)Port of LazyBear's Weis Wave Volume indicator to pinescript v4 from v2.
